Case Studies
Case Studies
- Construction of A New Organic-inorganic Composite Emulsion and Its Enhanced Mechanical Properties of Oil Well Cement(Part 1)
- Construction of A New Organic-inorganic Composite Emulsion and Its Enhanced Mechanical Properties of Oil Well Cement(Part 2)
- The Application Prospects of DeepSeek Large Model in Petroleum Engineering(Part 1)
- The Application Prospects of DeepSeek Large Model in Petroleum Engineering(Part 2)
- Development and Performance Evaluation of Efficient Asphalt Dispersant (Part 1)
- Development and Performance Evaluation of Efficient Asphalt Dispersant (Part 2)
- Development and Performance Evaluation of Efficient Asphalt Dispersant (Part 3)
- Research and Application Status of Drilling Fluid Plugging Materials (Part 1)
- Research and Application Status of Drilling Fluid Plugging Materials (Part 2)
- Research and Application Status of Drilling Fluid Plugging Materials (Part 3)
2.2 Pipeline Reliability Analysis
During the single-phase flow of white oil in the pipeline, it is in the laminar flow zone, and the fluid at the pipe wall flows in layers without mass exchange between layers. According to the theory of fluid mechanics, for the analysis of fluid equilibrium forces in the cross-section of a pipeline, the shear stress at the pipe wall is
.png)
The shear rate at the wall of the laminar flow zone is the effective shear rate of the liquid flowing through the pipe under the corresponding conditions. The effective shear rate of Newtonian fluid in laminar flow can be calculated using equation (3)
.png)
Analyze the flow characteristics of heavy oil pipelines in horizontal testing sections and evaluate the accuracy and effectiveness of the pipeline flow testing system. The relationship between shear stress and shear rate of two types of white oil under single-phase flow in the annulus was obtained using equations (2) and (3), and compared with the results of rheometer tests at the same temperature, as shown in Figure 5.
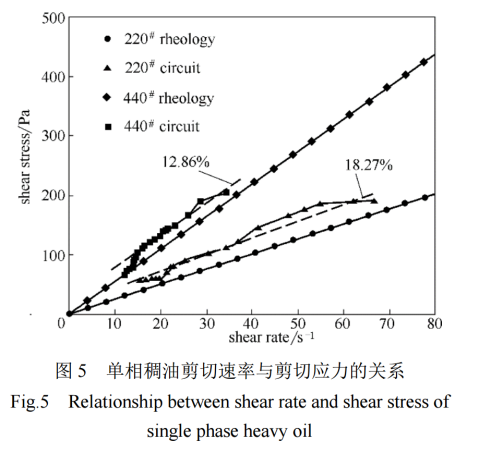
From Figure 5, it can be seen that the simulated shear stress of the two types of white oil rings is generally higher than the rheometer test results. This may be due to the relatively low oil temperature at the contact surface when the oil comes into contact with the inner wall of the pipeline, resulting in higher shear stress at the same shear rate.However, the average relative deviation is within 20%, which indirectly verifies the high accuracy, effective test results, and good reliability of the loop simulation device under single-phase oil flow conditions within the allowable error range.
2.3 Flow Pattern Characteristics
High speed cameras were used to capture the flow patterns of two types of white oil and air in pipelines at different blending ratios. The typical flow patterns are shown in Figure 6.Using 220 # white oil as an example, when the flow rate of white oil is constant, with the increase of air flow rate or velocity, the flow patterns inside the pipe change in the following order: bubbly flow, slug flow, stratified flow, slug flow, annular flow, and misty flow.
.png)
When the gas-liquid ratio is less than 0.3, the flow pattern is mainly bubbly flow. The gas in the pipeline is distributed in the form of bubbles in the upper part of the pipeline, and the flow is relatively stable. The reason is that there is less gas, forming dispersed small bubbles with lower gas density, and suspending in the upper part of the oil to form bubbly flow;When the gas-liquid ratio is between 0.3 and 0.6, it is mainly a slug flow, with small bubbles gradually increasing and suspended in the upper part of the pipeline. The main reason for this is that as the gas volume increases, dispersed small bubbles converge into large bubbles, forming bubbles in the upper part of the pipeline and causing intermittent oil flow. At the same time, the bubbles push the oil forward.
When the gas-liquid ratio increases to 3.5-4.4, a circular flow appears in the pipeline, where the oil phase adheres to the pipe wall and flows slowly, while the gas phase distributes in the center of the pipeline and flows faster. This is mainly due to the further increase in gas volume, which disperses the oil flow of the slug and forms a circular flow of oil flow at the edge of the central airflow.When the gas-liquid ratio increases to 4.4-15, the main flow in the pipeline is misty, mainly due to the oil attached to the pipe wall being blown away and mixed in the gas phase in the form of small droplets. When annular flow and misty flow occur, the oil phase flow rate is low, which is not conducive to the transportation of the oil phase.
Compared with 440# white oil, it was found that with the increase of viscosity, the range of gas mixing ratio for laminar flow became smaller. The main reason for this is that: on the one hand, as the viscosity increases, bubbly flow gathers to form stratified flow, requiring higher gas mixing volume; on the other hand, as the viscosity increases, interlayer shear stress increases, making it easier for the liquid to gather forward and fill the pipeline section, forming a slug.
According to relevant research and analysis of the above flow pattern results, the main factors affecting these flow pattern changes include interfacial tension between gas-liquid phases, pipe wall roughness, and liquid pipe wall contact angle.
2.4 Analysis of Pressure Drop Pattern
Calculate the relative drag reduction rate of 220 # and 440 # white oil in horizontal pipelines at different flow ratios according to equation (1), as shown in Table 1. Calculate and analyze the relative drag reduction rate, as shown in Figure 7.From this, it can be seen that with the increase of the blending ratio, the drag reduction rates of both types of white oils generally show an upward downward upward stable trend. As the viscosity of the oil increases, the overall drag reduction rate shows a downward trend.
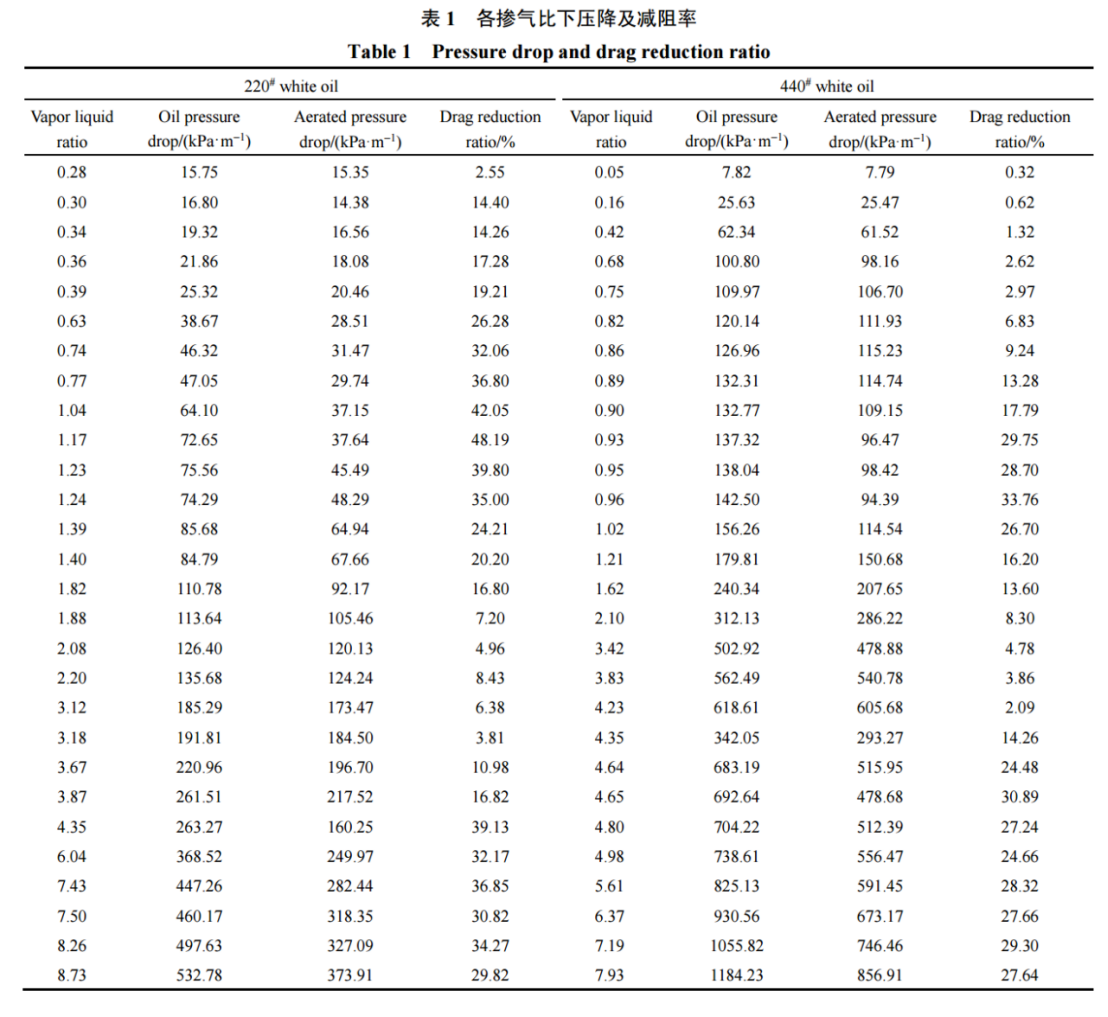
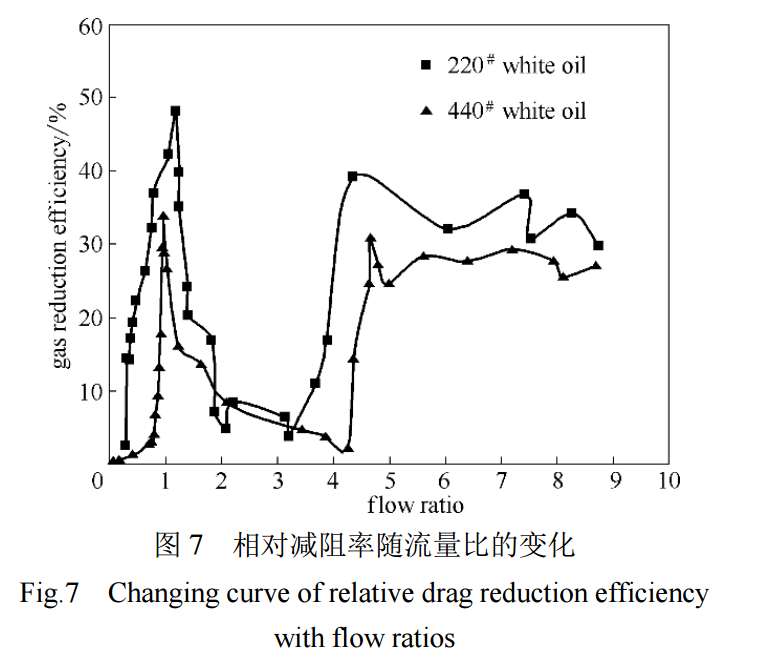
Using 220# white oil as an example, when the gas-liquid ratio is below 0.3, the drag reduction effect is not significant with the increase of the blending ratio.The main reason is that the gas flow rate is too low, which not only fails to form a complete gas film layer between the oil walls, but also causes small bubbles to be dispersed and damaged by white oil, resulting in bubbly flow in the upper part of the pipeline. As a result, the viscosity and flow resistance during gas-liquid mixing do not decrease significantly. As the viscosity of the oil increases, the gas-liquid ratio shifts to the right under this trend.
When the gas-liquid ratio is in the range of 0.3 to 1.17, the drag reduction rate shows an increasing trend with the increase of the blending ratio, and the drag reduction rate can reach more than 20%. The flow patterns are mainly slug flow and stratified flow. As the gas flow rate increases, on the one hand, the gas film isolates the oil wall interface, effectively reducing the frictional resistance of the oil near the pipe wall flow interface layer. On the other hand, air transforms the oil oil contact into oil gas oil contact, reducing the interlayer shear stress of the mixed phase. The interaction between the two significantly increases the drag reduction rate.When the viscosity of the oil increases, the gas-liquid ratio range under this trend decreases.When the gas-liquid ratio is in the range of 1.17-3.5, the drag reduction rate decreases with the increase of the blending ratio, and the flow patterns are mainly stratified flow and slug flow. The main reason is that with the increase of air content, a slug flow gradually forms in the pipeline, increasing the pressure between the oil walls, thereby increasing the frictional resistance of the pipeline and the pressure drop instead. When the viscosity of the oil increases, the range of gas-liquid ratio under this trend increases.
When the gas-liquid ratio is greater than 3.5, the drag reduction rate first shows an upward trend with the increase of the blending ratio, and then tends to stabilize. The flow patterns are mainly annular flow and misty flow. At this point, the pipeline is filled with a large amount of gas, and the contact area between the gas walls gradually increases and tends to stabilize, thereby significantly reducing the frictional resistance of the pipeline.When the viscosity of the oil increases, the gas-liquid ratio shifts to the right under this trend. But in this working condition, the gas occupies too much of the circulation area, which is not conducive to the transportation of oil products.
Under the same operating conditions, the overall drag reduction rate of 220# white oil is higher than that of 440 # white oil, and the adjustable range of gas-liquid ratio is wider at the same drag reduction rate. In the process of heavy oil blending transportation, the drag reduction effect is better under the condition of gas-liquid ratio less than 2.When the gas-liquid ratio is 1.17, the drag reduction rate of 220# white oil is the highest, at 48.19%. When the gas-liquid ratio is 0.47-1.4, the drag reduction efficiency of the blended 220# white oil is higher than 30%; When the gas-liquid ratio is 0.96, the drag reduction rate of 440# white oil is the highest, reaching 33.76%. When the gas-liquid ratio is between 0.9 and 1.2, the drag reduction efficiency of blending on 440# white oil is higher than 20%. So, when the blending ratio of two types of white oil is 0.9-1.2, the drag reduction rate can both reach over 20%.
2.5 Establishment of Pressure Drop Model
At present, the most commonly used formulas for calculating pressure drop in oil and gas mixed transportation are the Dukler I method, Dukler II method, and Beggs Brill method. These three models are established based on the assumptions of homogeneous flow, phase separated flow, and flow pattern, respectively.This article compares the Dukler I method and the Dukler II method to explore a suitable pressure drop prediction model for heavy oil mixed with gas flow.
(1) Dukler I and Dukler II Methods
The Dukler I method assumes that the gas and liquid phases are uniformly mixed in the pipeline, and hydraulic calculations are performed using the method of single-phase pipe flow. The parameters related to single-phase fluid in the formula are replaced with the average parameters of gas-liquid mixed flow. The pressure drop in the pipeline is calculated using Darcy's formula.
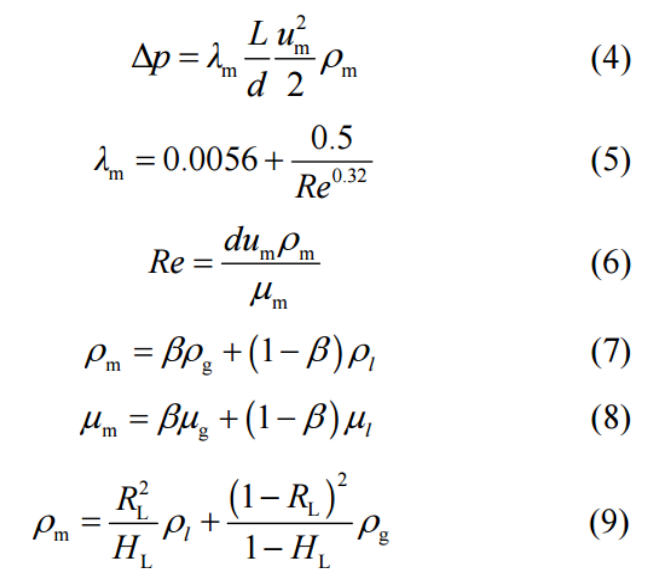
The Dukler I method (predicted value I) was used to calculate the pressure drop of two types of white oil. The comparison between the predicted and measured values is shown in Figure 8.
.png)
The Dukler II method believes that gas-liquid two-phase flow can only be approximated as phase slip free when the flow velocity is very high, while in actual pipelines, the flow velocity of gas-liquid two-phase flow is generally different, and there is phase slip between the two phases.Using the similarity theory, assuming that the sliding ratio between the gas-liquid phases does not change along the length of the tube, a pressure drop calculation method is proposed when there is slippage between phases.The pressure drop is also calculated using Darcy's formula. The density of gas-liquid mixture is calculated as follows.
At this point, the hydraulic friction coefficient of gas-liquid horizontal mixed transportation is calculated as follows:
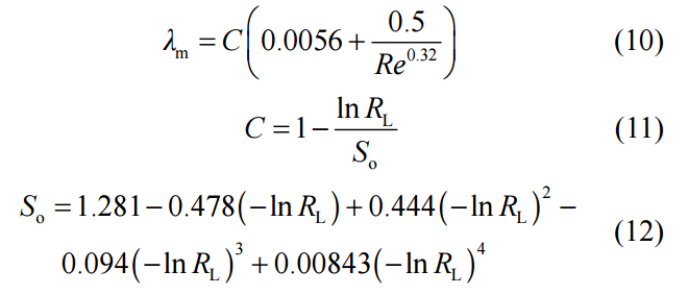
The comparison results between the measured pressure drop values for two types of white oil and the predicted values using the Dukler II method (predicted value II) are shown in Figure 9.
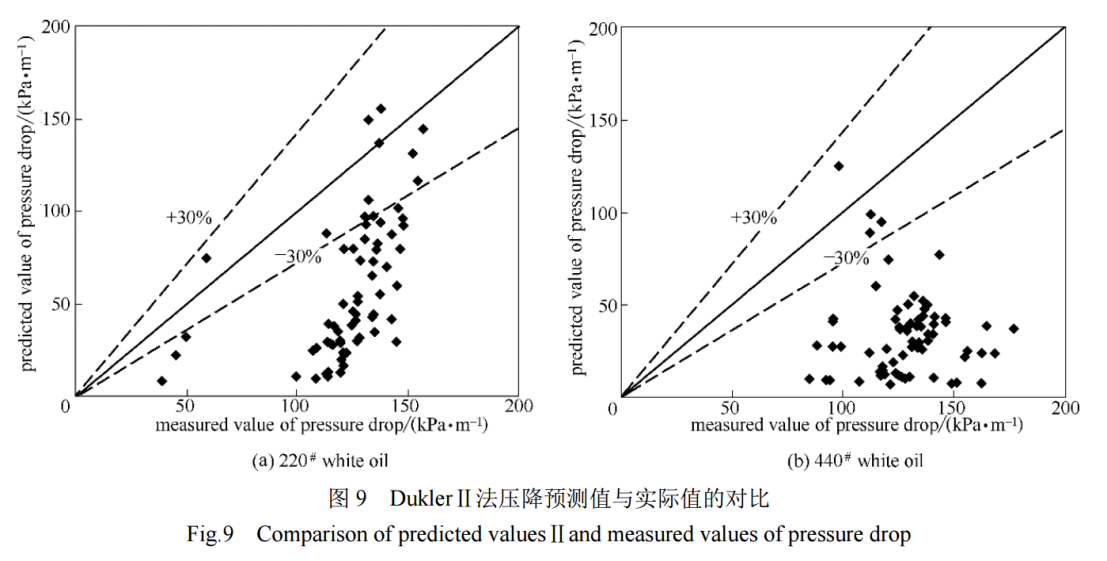
From Figures 8 and 9, it can be seen that when using the Dukler I method, the average relative errors of 220# and 440# white oil are 69.87% and 87.83%, respectively, and the predicted values are smaller than the actual values. This phenomenon becomes more pronounced as the viscosity increases;However, when using the Dukler II method, the average relative errors of 220# and 440# white oils were 54.52% and 72.01%, respectively. Although the predicted values were also smaller than the actual values, the measured values of the two white oils were relatively close to the predicted values, and the smaller the viscosity, the smaller the degree of prediction deviation.The main reason for its crude oil is that, on the one hand, the Dukler II method considers the influence of volumetric and cross-sectional liquid content on its friction coefficient, so the predicted pressure drop is relatively accurate;On the other hand, both the Dukler I and Dukler II methods did not consider the influence of oil viscosity, blending ratio, and other factors on its pressure drop. As the liquid viscosity increases, these factors cannot be ignored. Therefore, when establishing a high viscosity gas-liquid two-phase flow pressure drop model, the influence of viscosity must be considered.
(2) Model Updating
From the above analysis, it can be seen that the predicted values of both pressure drop models are smaller than the actual values. The predicted values calculated by the Dukler I method have a large deviation from the actual values, while the predicted values by the Dukler II method are closer to the actual values.It is known that the Dukler II method is more suitable for predicting the pressure drop of heavy oil blending. Therefore, this article modifies the pressure drop model of the Dukler II method, considers factors such as viscosity and gas-liquid ratio, and uses nonlinear regression to establish a pressure drop model suitable for high viscosity gas-liquid two-phase flow. The pressure drop of the pipeline is calculated using Darcy's formula, mainly to correct its friction coefficient.
Firstly, based on the pressure drop variation law, the blending ratio is divided into three ranges: gas-liquid ratio less than 1.5, gas-liquid ratio between 1.5 and 3.5, and gas-liquid ratio greater than 3.5.
Secondly, a single factor variable analysis was conducted on the experimental results of 220# white oil at various blending ratios. The gas-liquid two-phase flow velocity and density, liquid-phase flow velocity, and volumetric liquid content all affect the friction coefficient of oil and gas two-phase flow.
To further analyze the influence of various factors on the friction coefficient, SPSS software was used to perform variance analysis on the experimental results of each group. It was found that when the gas-liquid ratio was less than 1.5, the liquid phase flow rate and volume fraction had a significant impact on the friction coefficient. When the gas-liquid ratio was between 1.5 and 3.5, the volume fraction had a greater impact on the friction coefficient. When the gas-liquid ratio was greater than 3.5, the volume fraction and gas-liquid ratio had a more significant impact on the friction coefficient.Perform nonlinear regression on various influencing factors to obtain a predictive model for the friction coefficient of oil and gas two-phase flow. The friction coefficient is calculated as follows.
When the gas-liquid ratio is less than 1.5:
.png)
When the gas-liquid ratio is between 1.5 and 3.5:
.png)
When the gas-liquid ratio is greater than 3.5:
.png)
Finally, the predicted pressure drop of 220 # white oil was compared with the actual value, as shown in Figure 10 (a). The pressure drop model was validated using experimental data from 440 # white oil, and the pressure drop values at each measurement point were calculated and compared with the actual values. The results are shown in Figure 10 (b).
.png)
From Figure 10, it can be seen that when using this correction model, the average relative errors between the predicted and actual pressure drop values of 200 # and 440 # white oil are 15.29% and 16.80%, respectively. Moreover, the deviation between the predicted and actual pressure drop values of more than 95% of the measurement points is within ± 25%. The calculated values are in good agreement with the experimental values, which verifies that the model can accurately predict the pressure drop of heavy oil blending, and also verifies that the correction model is applicable to a wide range of viscosity and flow rates. Therefore, when calculating the pressure drop of gas-liquid two-phase flow in high viscosity fluids, it is necessary to consider the effects of liquid phase viscosity and volume fraction.
3.Conclusions
(1) The higher the flow rate of the two types of heavy oil, the higher the pressure drop in the pipeline flow, and the higher the oil viscosity, the greater the pressure drop. As the flow rate of heavy oil increases, the friction resistance coefficient decreases sharply and then tends to flatten out, and the higher the oil viscosity, the greater the friction resistance coefficient. The deviation between the pipe flow simulation results and the rheological test results is small, and the agreement is high.
(2) Under experimental conditions, the maximum drag reduction rate of 220# white oil is 48.19% when the gas-liquid ratio is 1.17# The drag reduction rate of 440# white oil is the highest at a gas-liquid ratio of 0.96, reaching 33.76%. When the gas-liquid ratio is 0.91.2, the drag reduction efficiency of both types of heavy oil by gas blending is higher than 20%; The mechanism can be attributed to the transformation of the oil oil contact surface into oil gas oil contact by air, reducing the interlayer shear stress of the mixed phase.
(3) When the flow rate of white oil is constant, as the gas mixing ratio increases, bubbly flow, slug flow, stratified flow, slug flow, annular flow, and misty flow can be observed in the pipe in sequence; Moreover, as the viscosity of the oil increases, the range of stable laminar flow and the range of other flow patterns become smaller and larger, respectively.
(4) Compared to the Dukler I method, the Dukler II method is more suitable for predicting pressure drop in heavy oil mixed with gas flow. A new model based on the Dukler II method can better predict pressure drop in heavy oil mixed with gas two-phase flow, with an average relative error of less than 20%. In the process of heavy oil recovery and transportation, the accuracy of predicting pressure drop in gas-liquid two-phase flow can be improved.


